**Vizta** is a revolutionary Business Intelligence (BI) platform designed to help businesses make better, faster, and more informed decisions by providing real-time insights and dynamic data visualizations...
Whether you're a small startup or a large enterprise, **Vizta**makes it easier to explore complex data sets and gain valuable insights...

Vizta India
December 13, 2022 • 6 min read

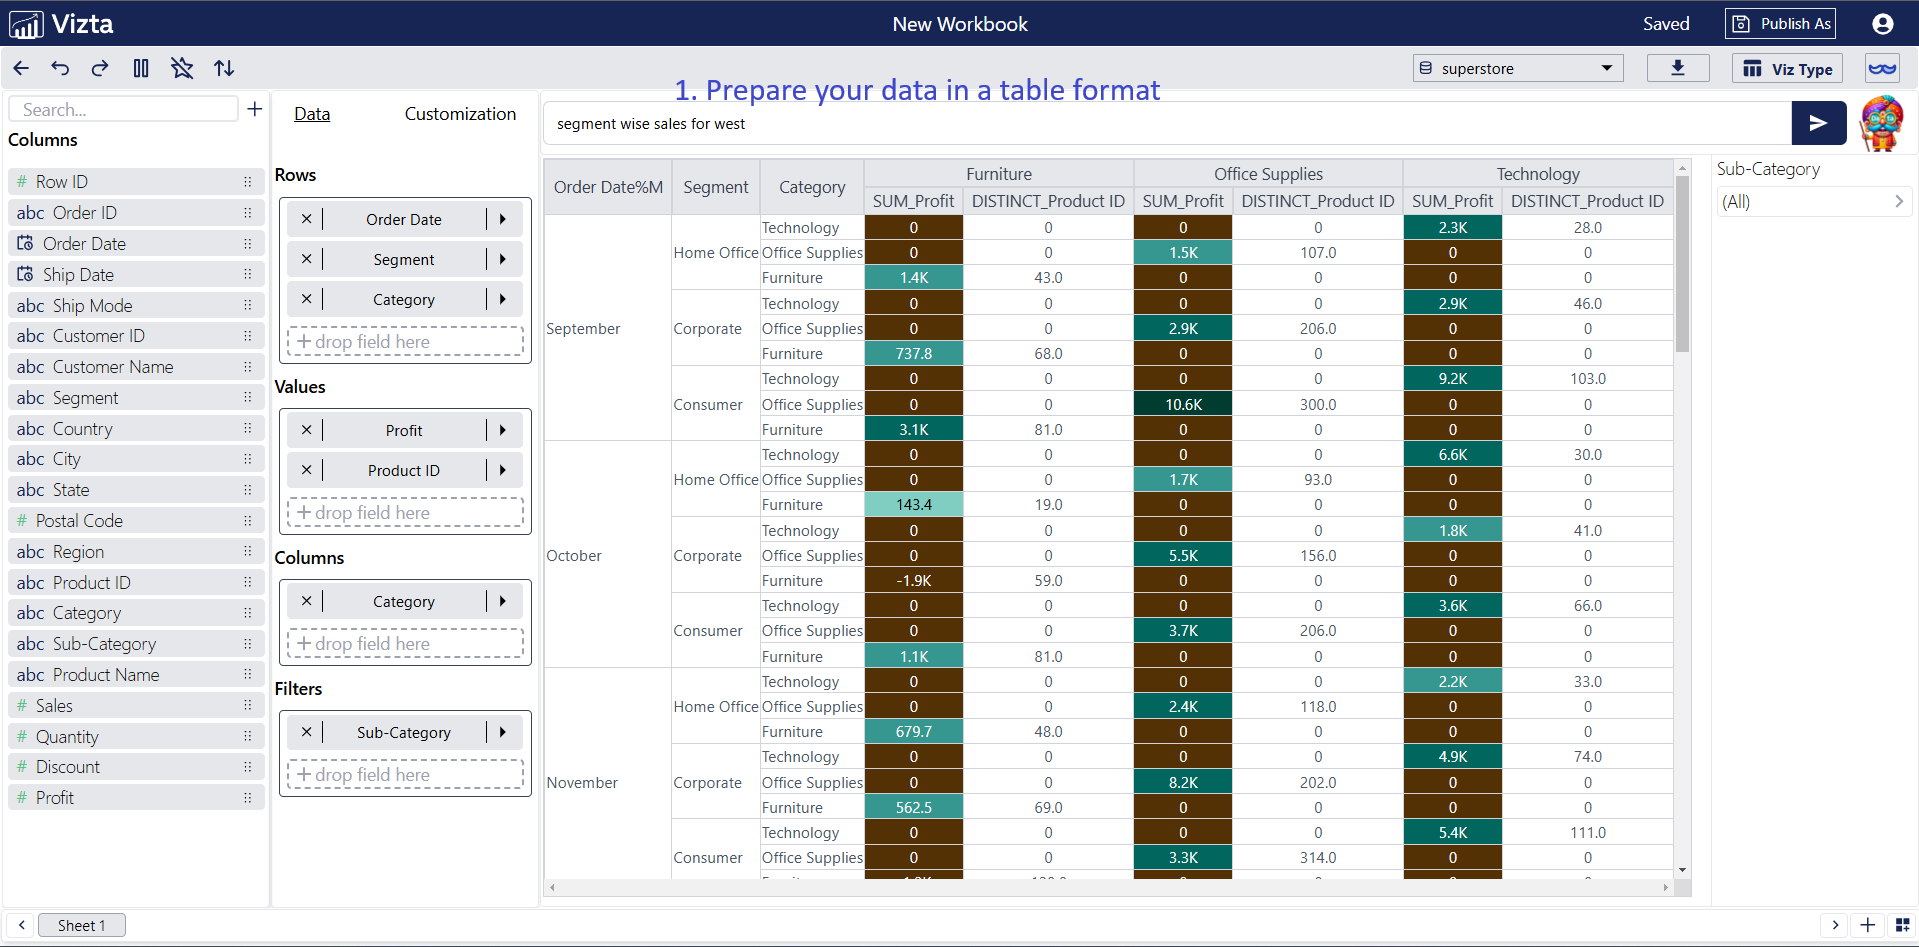
**Vizta** offers a wide range of features designed to simplify data analysis and provide meaningful insights. Here are some key functionalities that set it apart:
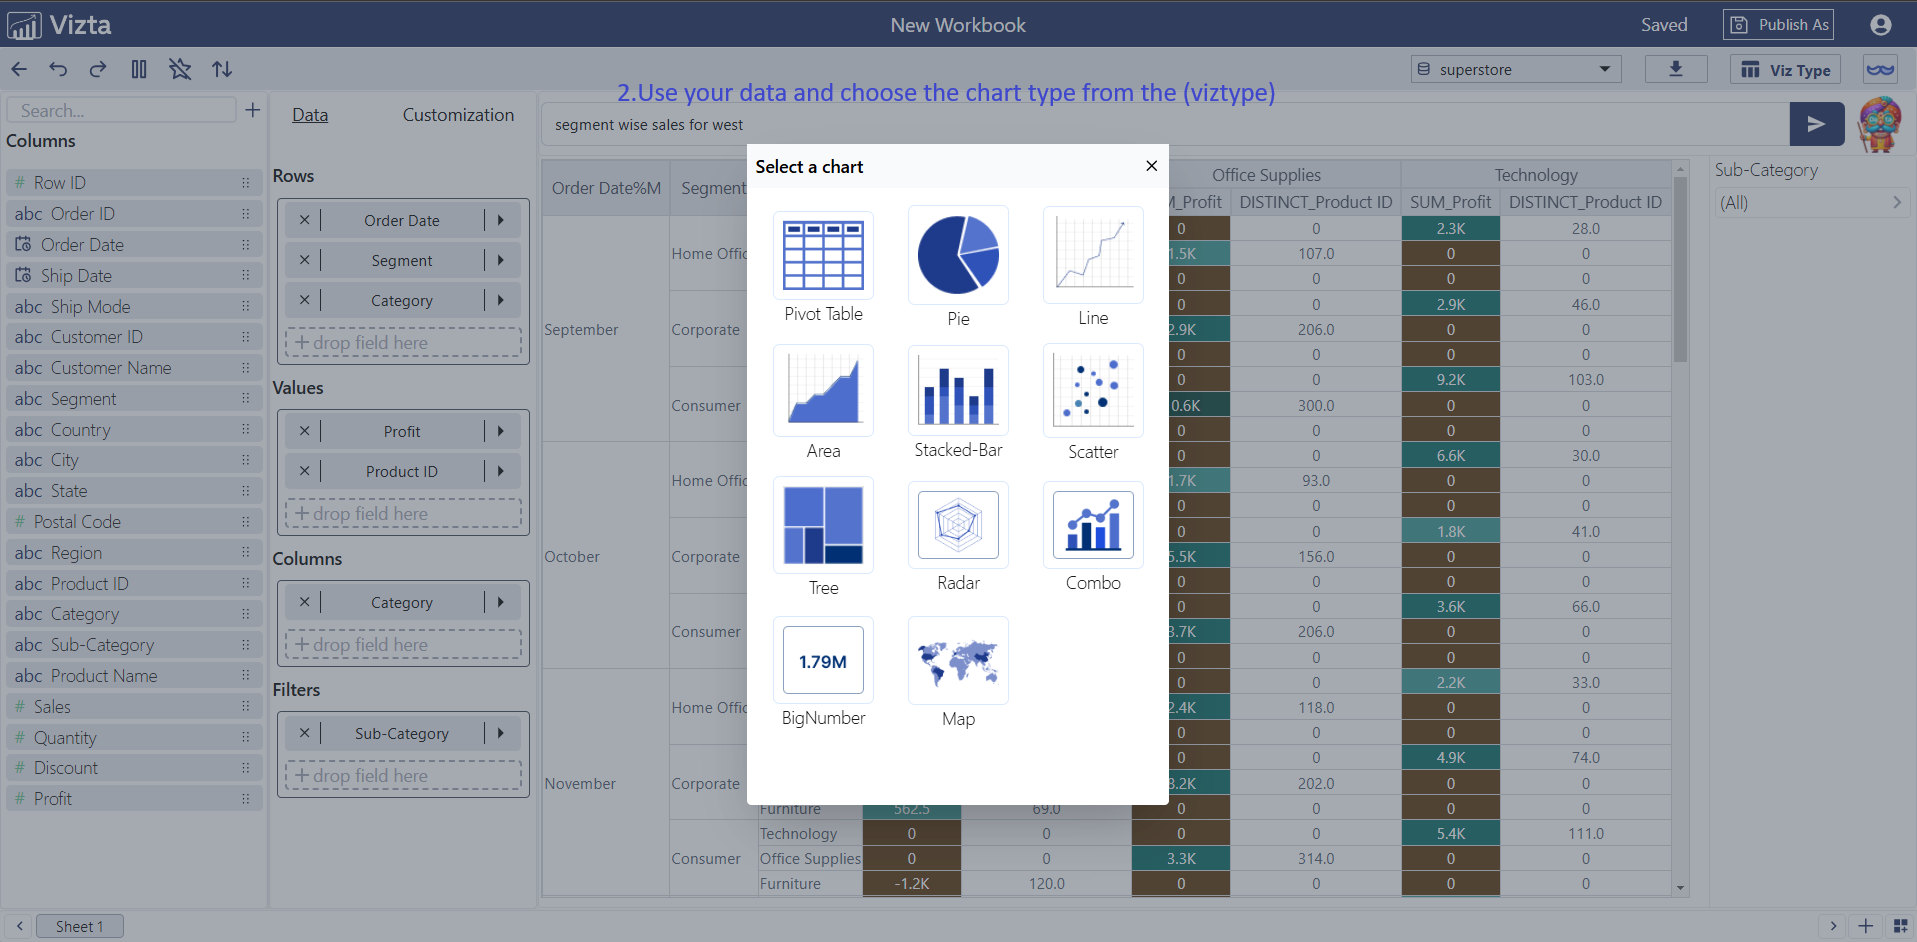
Choosing the right chart type is crucial in effectively communicating your data. Here are some of the best chart types for data visualization:
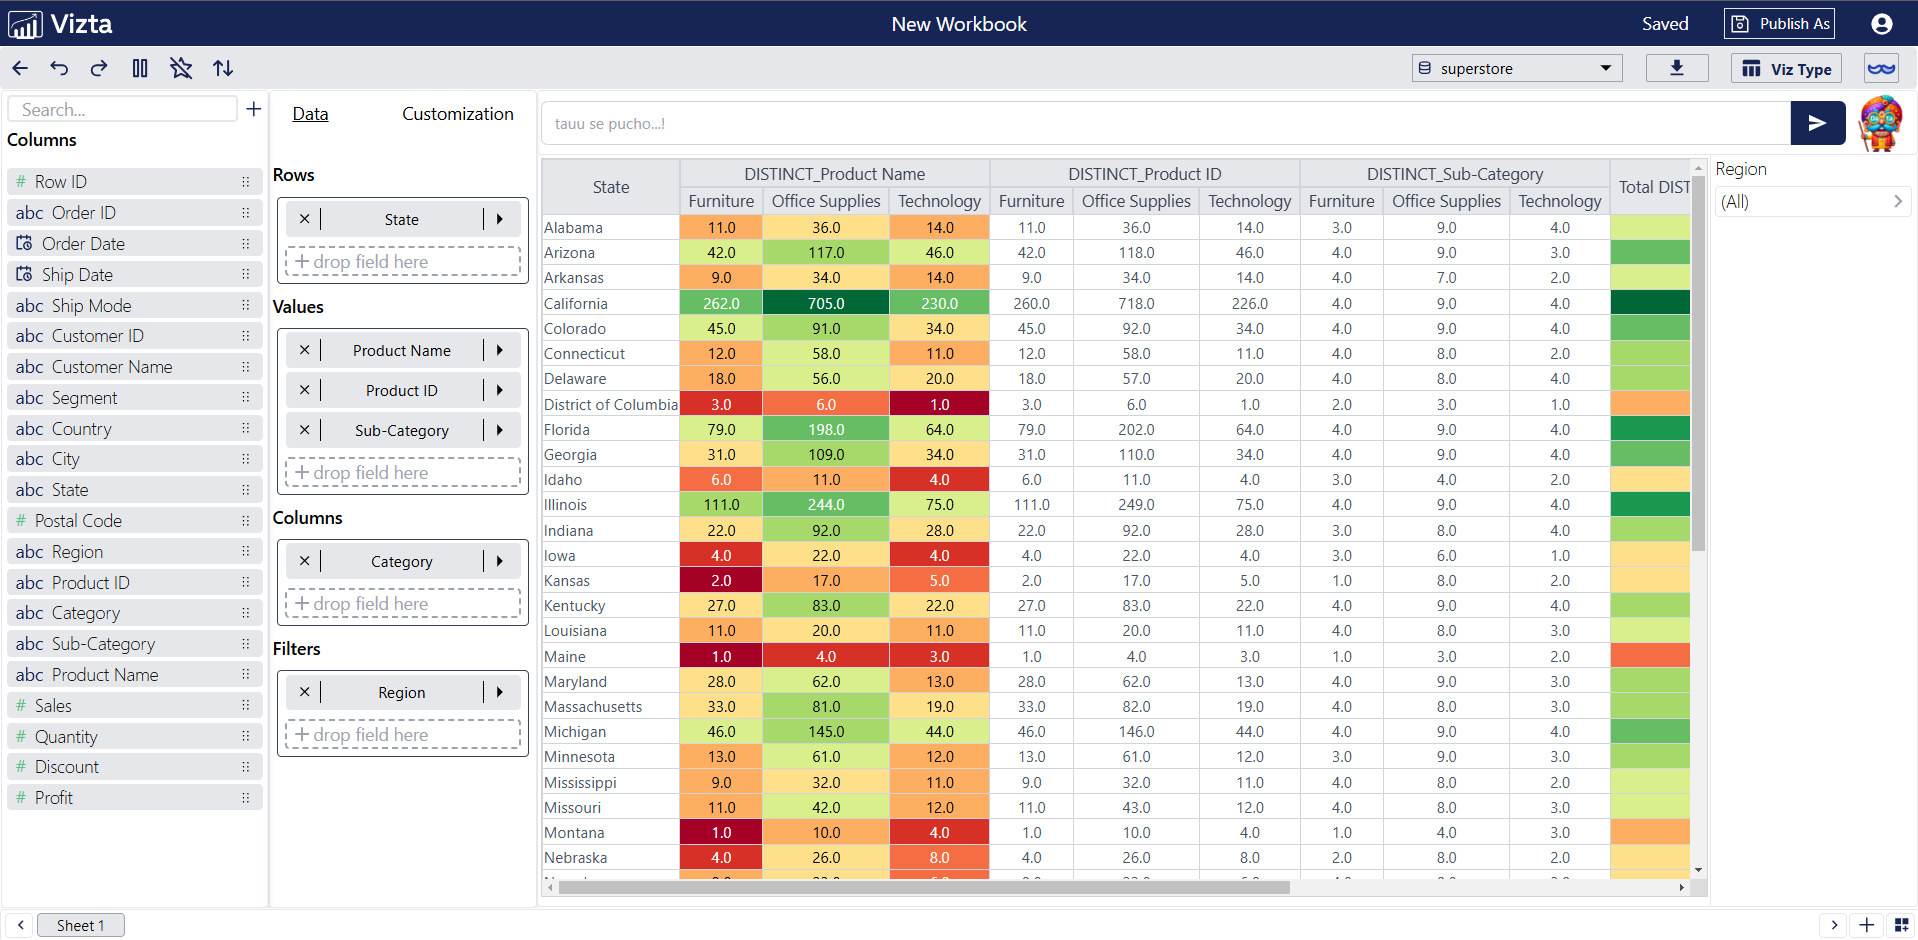
Vizta is a powerful tool for creating basic data visualizations. Learn how to create bar charts, line graphs, and more with Vizta:
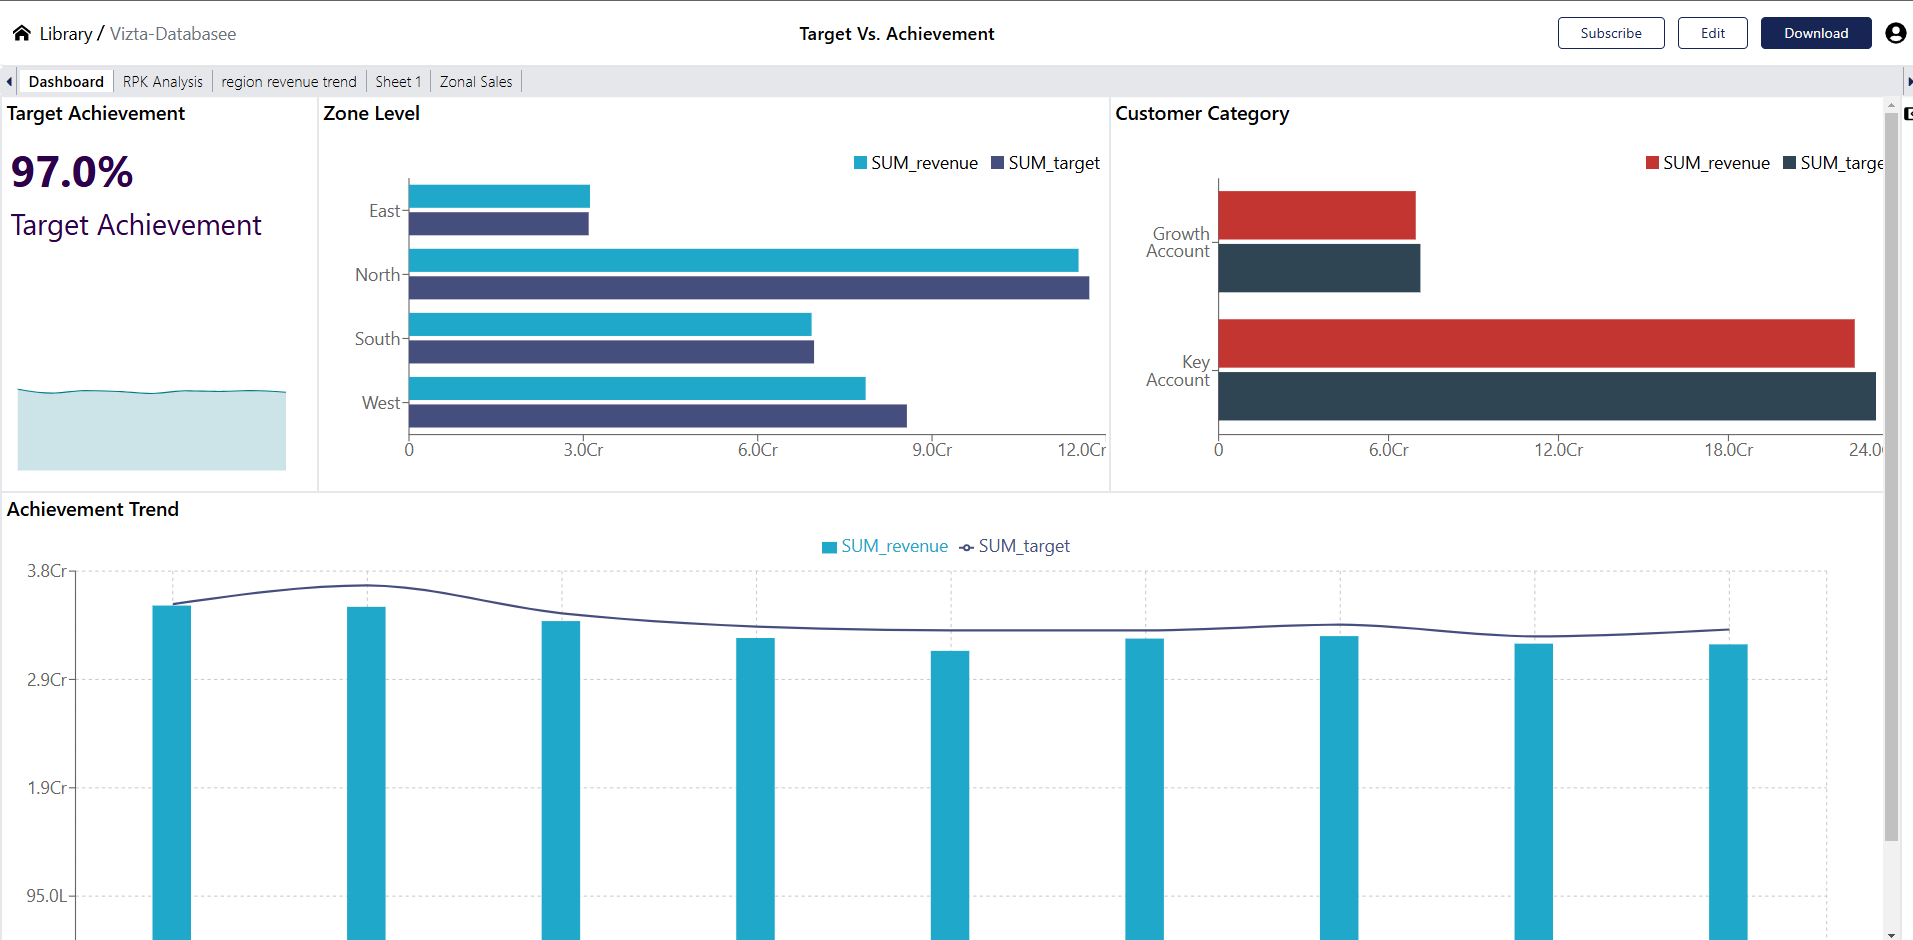
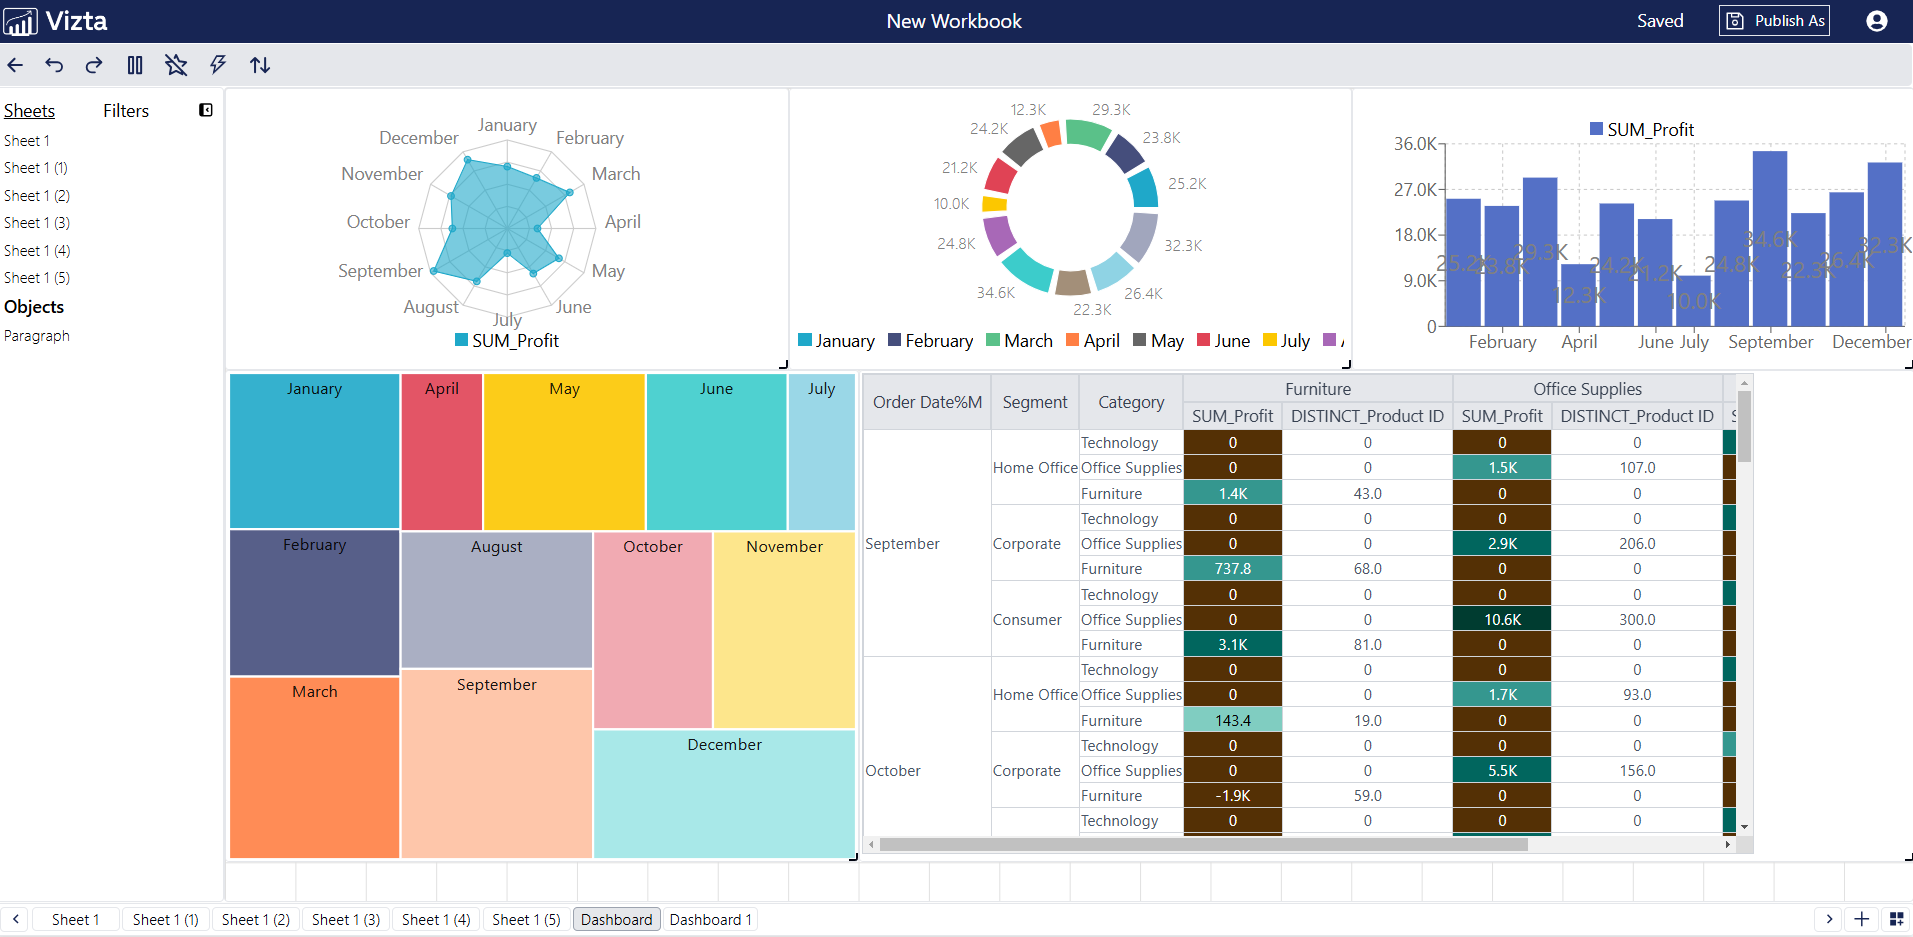
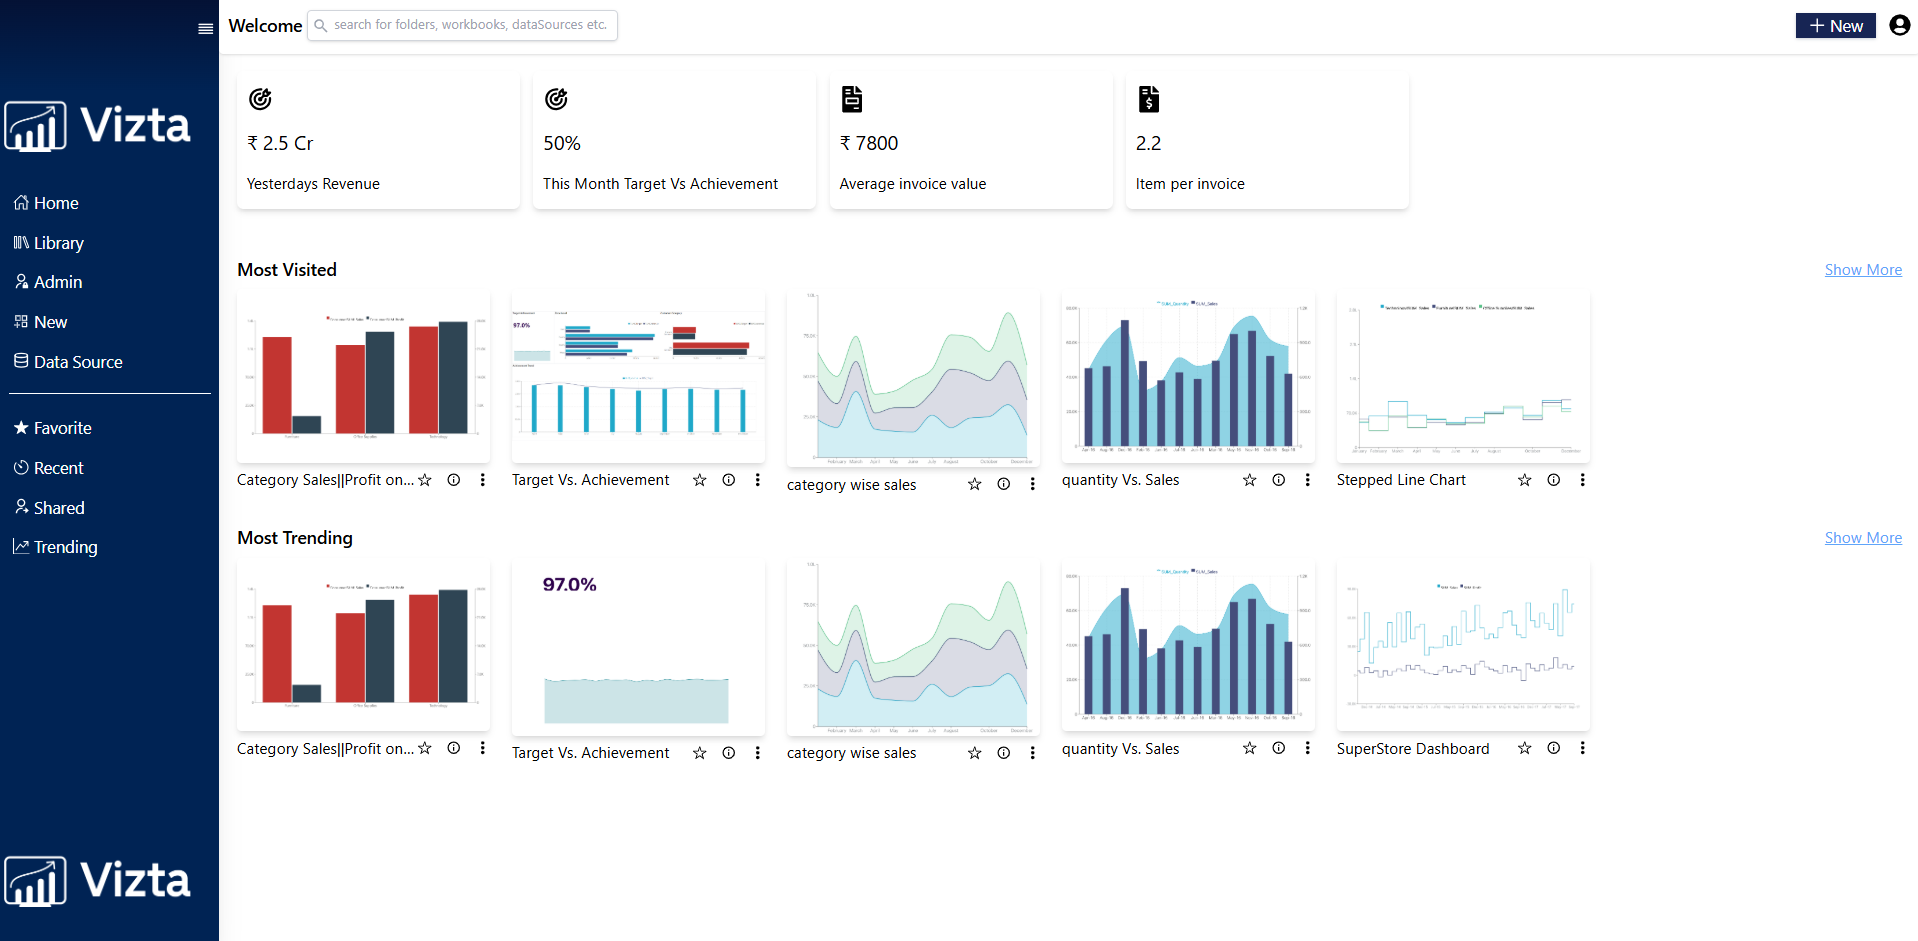
Dashboards are essential for analysts to monitor key metrics in real-time. Learn how to build customizable data dashboards:
Data visualization software is crucial for creating insightful reports that communicate complex data. Discover the top tools for effective data presentation:
Data visualization can be intimidating for beginners, but with the right techniques, anyone can start creating effective charts and graphs. Here’s how:
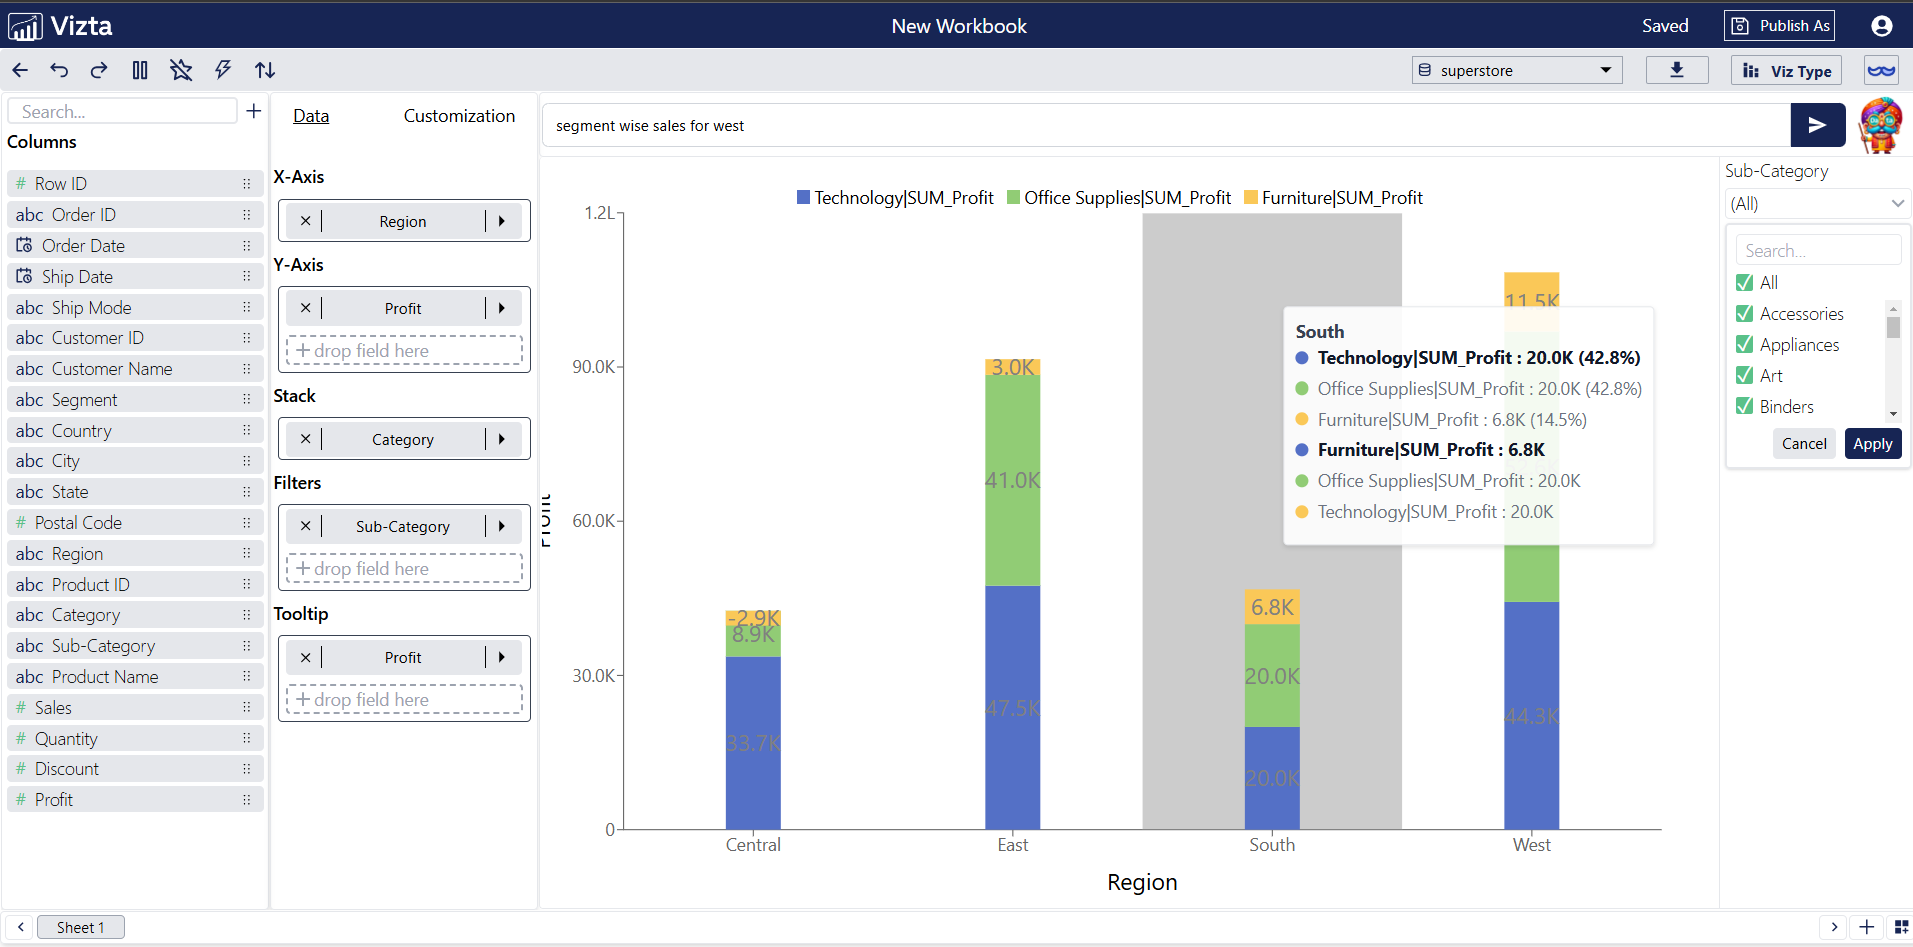
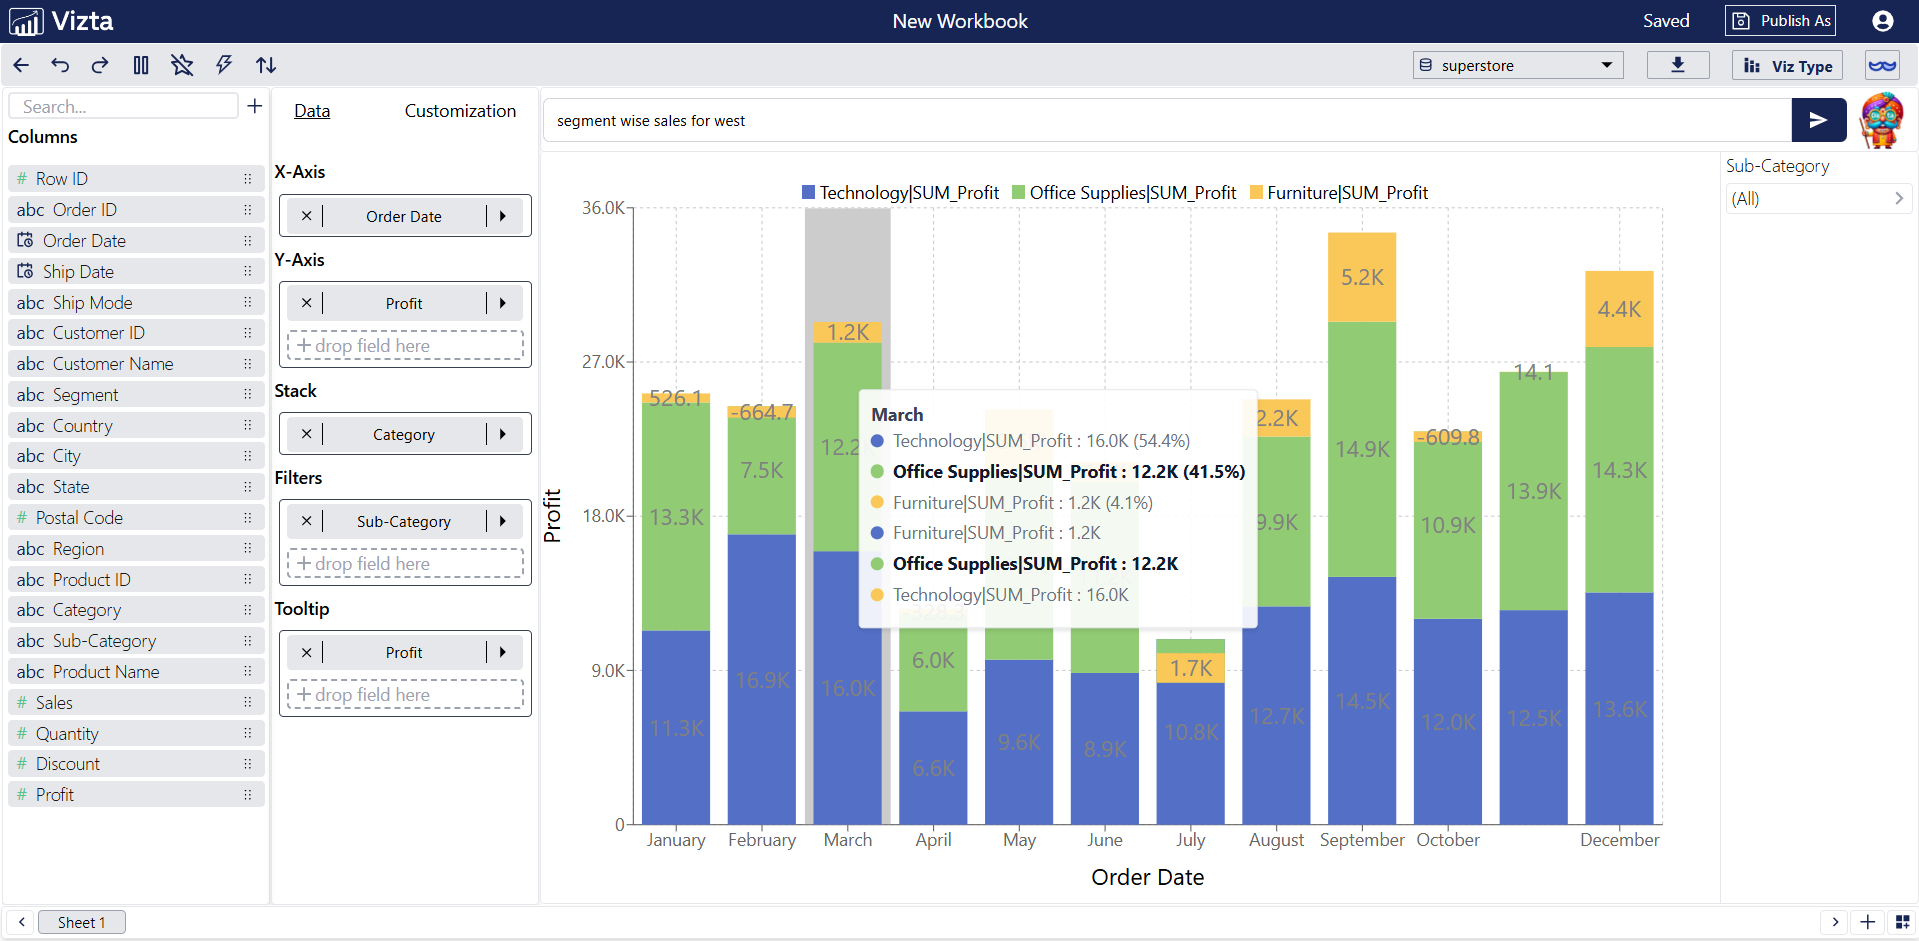
Interactive charts allow users to explore data dynamically. Learn how to integrate interactive charts into your data analysis workflow: