
**Vizta** is an advanced Business Intelligence (BI) platform designed to empower businesses with real-time insights and personalized data visualizations. By enabling smarter, data-driven decision-making, Vizta is transforming how organizations approach complex business challenges. Let’s explore the top 5 features of Vizta that are revolutionizing the decision-making process:

Vizta India
January 13, 2025 • 6 min read

**Vizta** offers a variety of powerful features that enhance decision-making and streamline data analysis. Below are the top 5 features that make Vizta a standout tool for organizations:
With Vizta, decision-makers no longer rely on static reports or complex spreadsheets. The interactive, real-time data visualizations allow teams to easily interpret critical business data, offering a clear path forward for both day-to-day and strategic decisions.
Exploratory Data Visualization (EDV) Exploratory data visualization is a hands-on approach where users interact with data to discover insights. It’s about asking questions and exploring different aspects of the data to understand its underlying patterns, trends, and anomalies. The goal is to "explore" the data, investigate it from multiple angles, and see what emerges. EDV allows users to: Drill down into specific subsets of data. Filter and zoom into different time periods or granular levels. Compare categories or metrics. Discover relationships and correlations. It's flexible, dynamic, and encourages curiosity—giving users the freedom to ask "what," "why," and "how" while diving into the data.
Explanatory Data Visualization (ExDV) On the other hand, explanatory data visualization focuses on presenting clear insights and telling a story with the data. It's used to communicate findings to an audience, typically decision-makers, by highlighting the most important and relevant aspects of the data. It’s about making the data understandable and accessible, showing the key points without overwhelming the viewer. ExDV is often used in: Reports and presentations for business leaders or stakeholders. Summarizing complex data in clear, actionable insights. Narrating a story where the visuals support a specific conclusion or decision. ExDV is more structured, aiming to highlight key takeaways rather than encourage exploration. It simplifies complex data, focusing on clarity and context to help people make informed decisions.
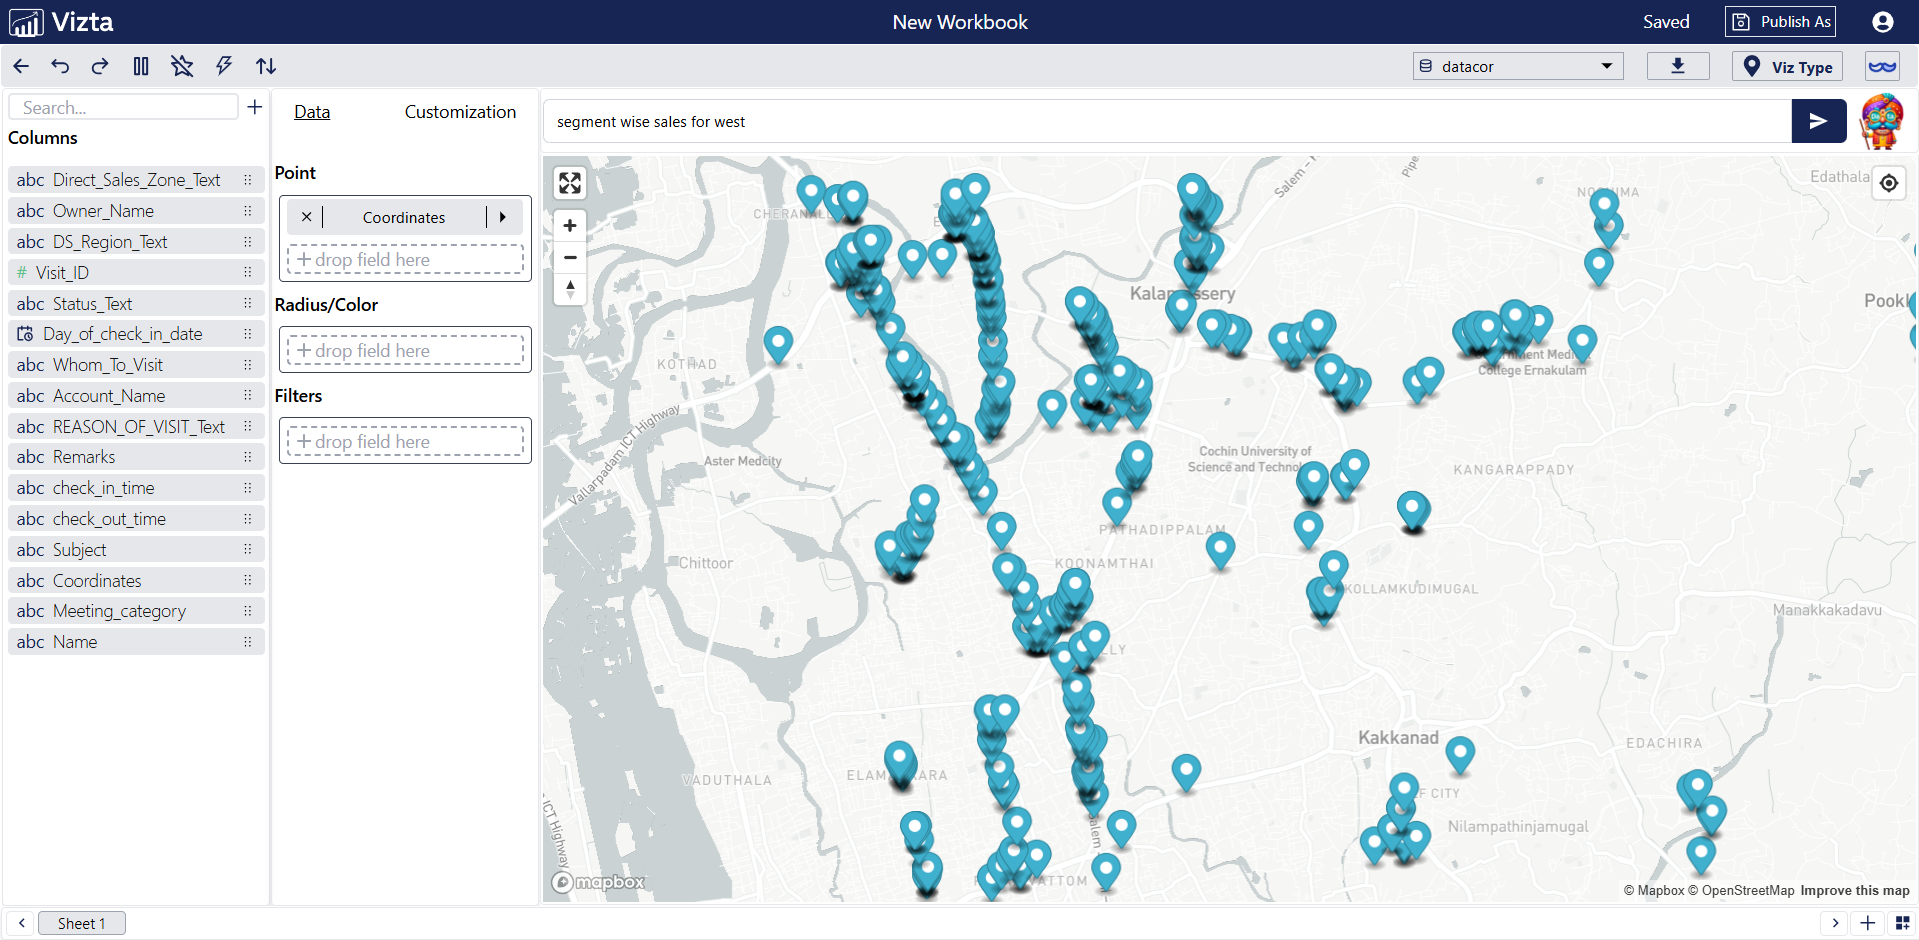
Maps provide a powerful way to visualize geographical data, offering insights that can drive location-based decision-making. Vizta integrates dynamic maps that allow users to overlay data on geographic regions, helping identify trends and patterns tied to specific locations.
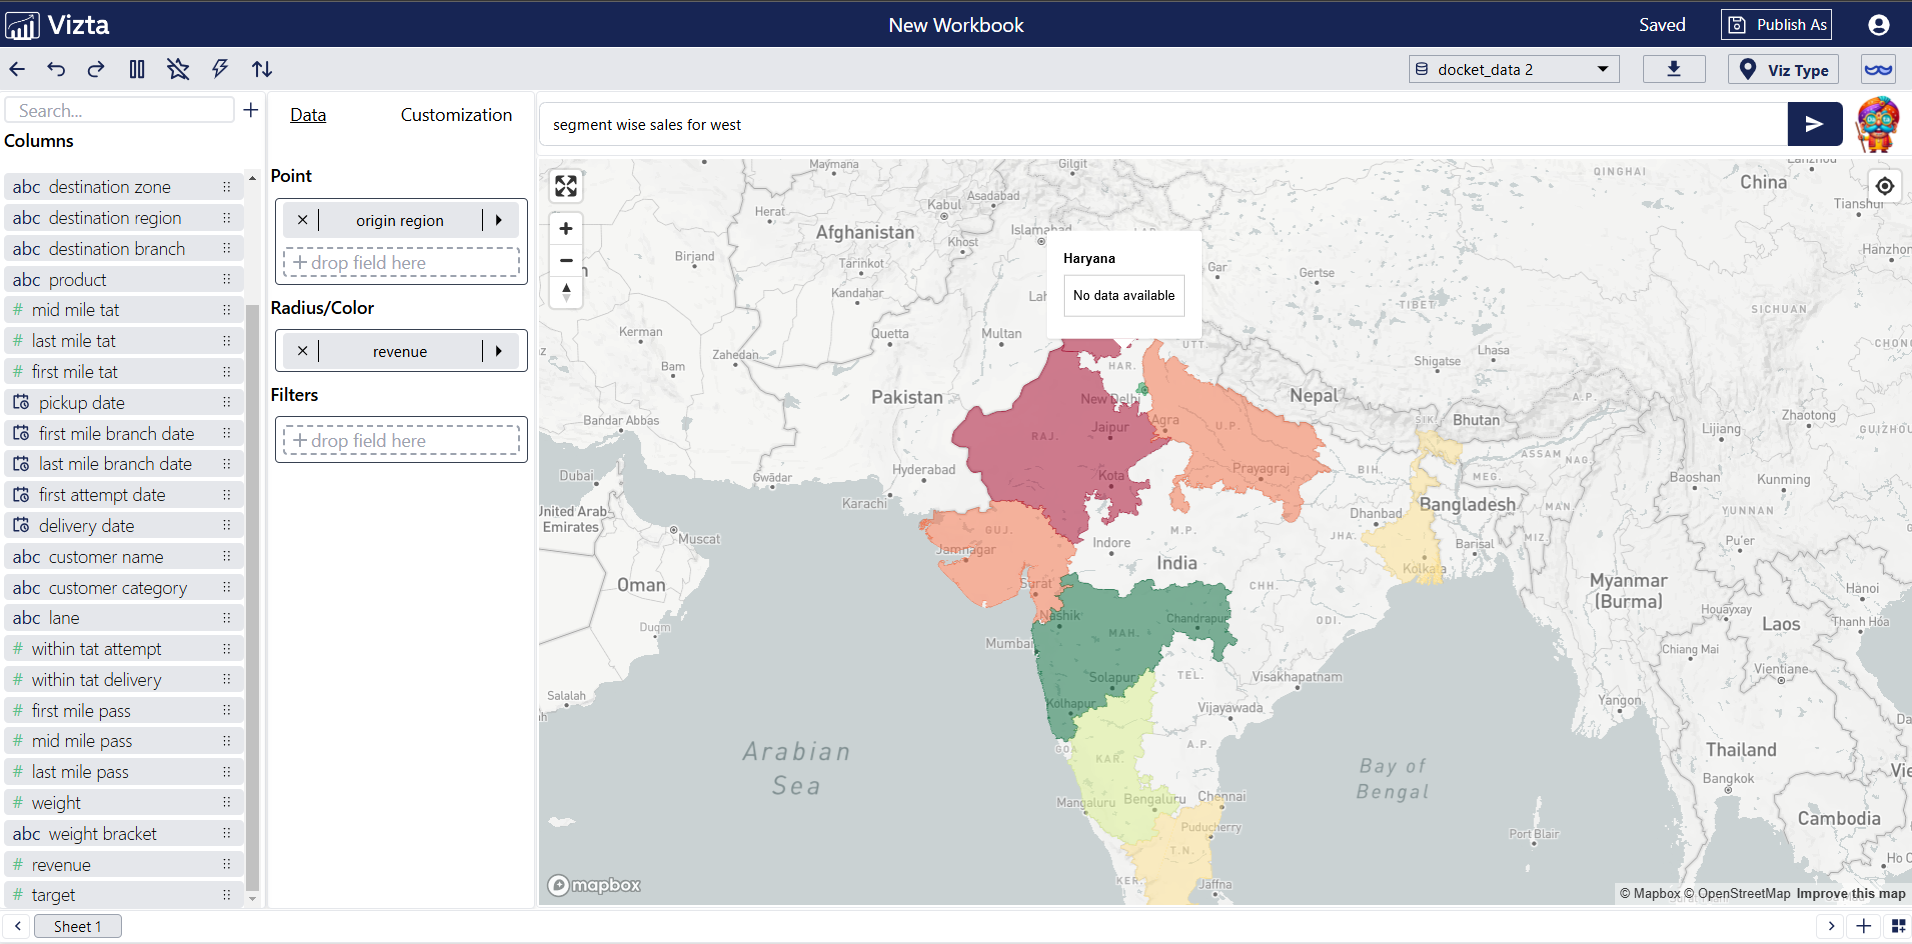
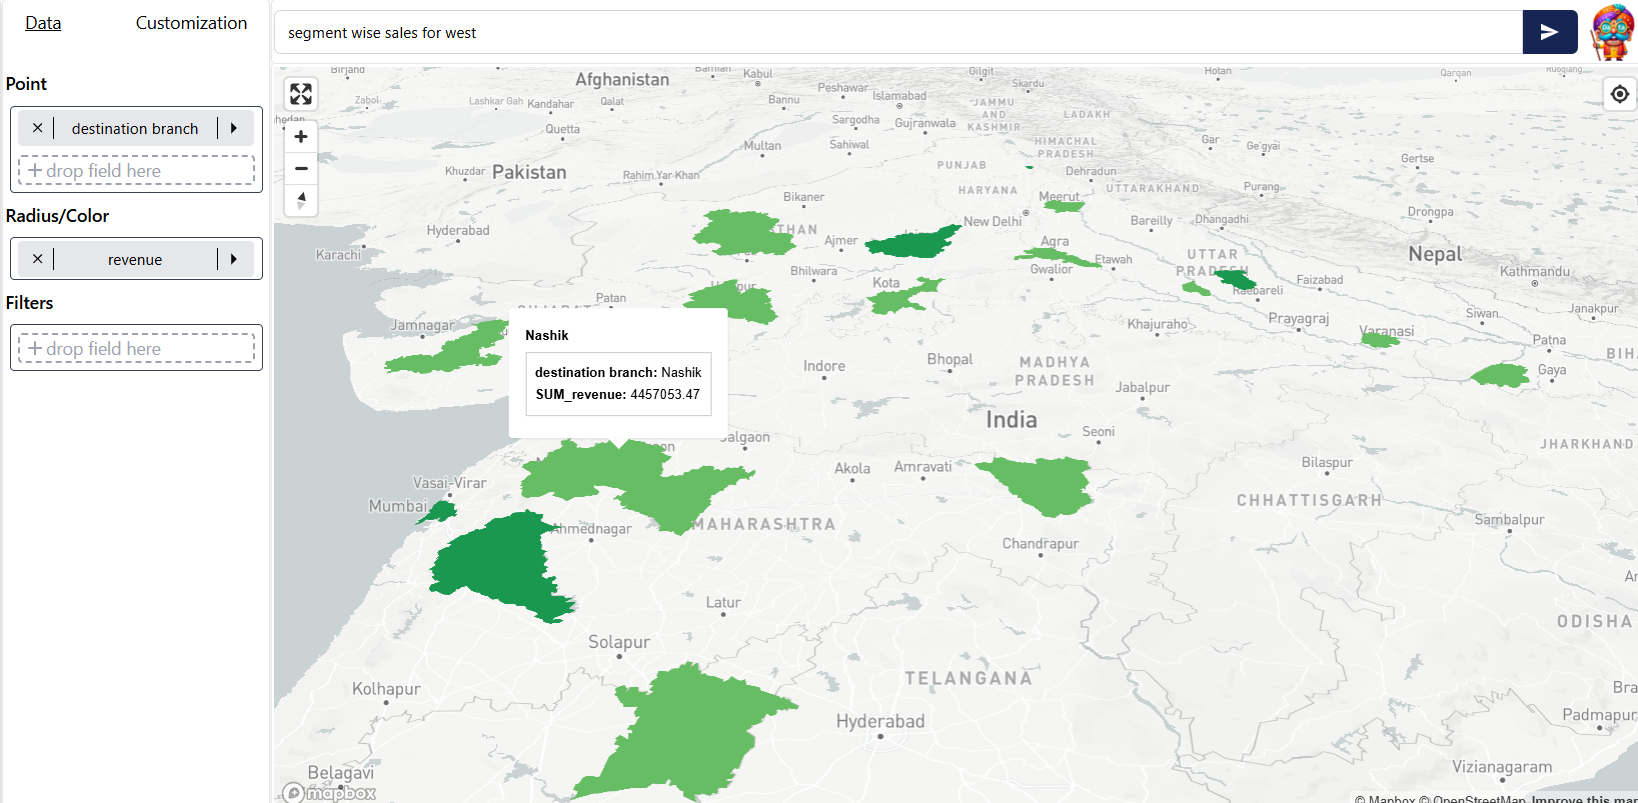
Maps provide a powerful way to visualize geographical data, offering insights that can drive location-based decision-making. Vizta integrates dynamic maps that allow users to overlay data on geographic regions. By using the coordinates of states or specific locations, the system can pinpoint and display markers directly on the map, helping identify trends and patterns tied to specific regions. This interactive approach enables users to explore and analyze data based on real-world locations.
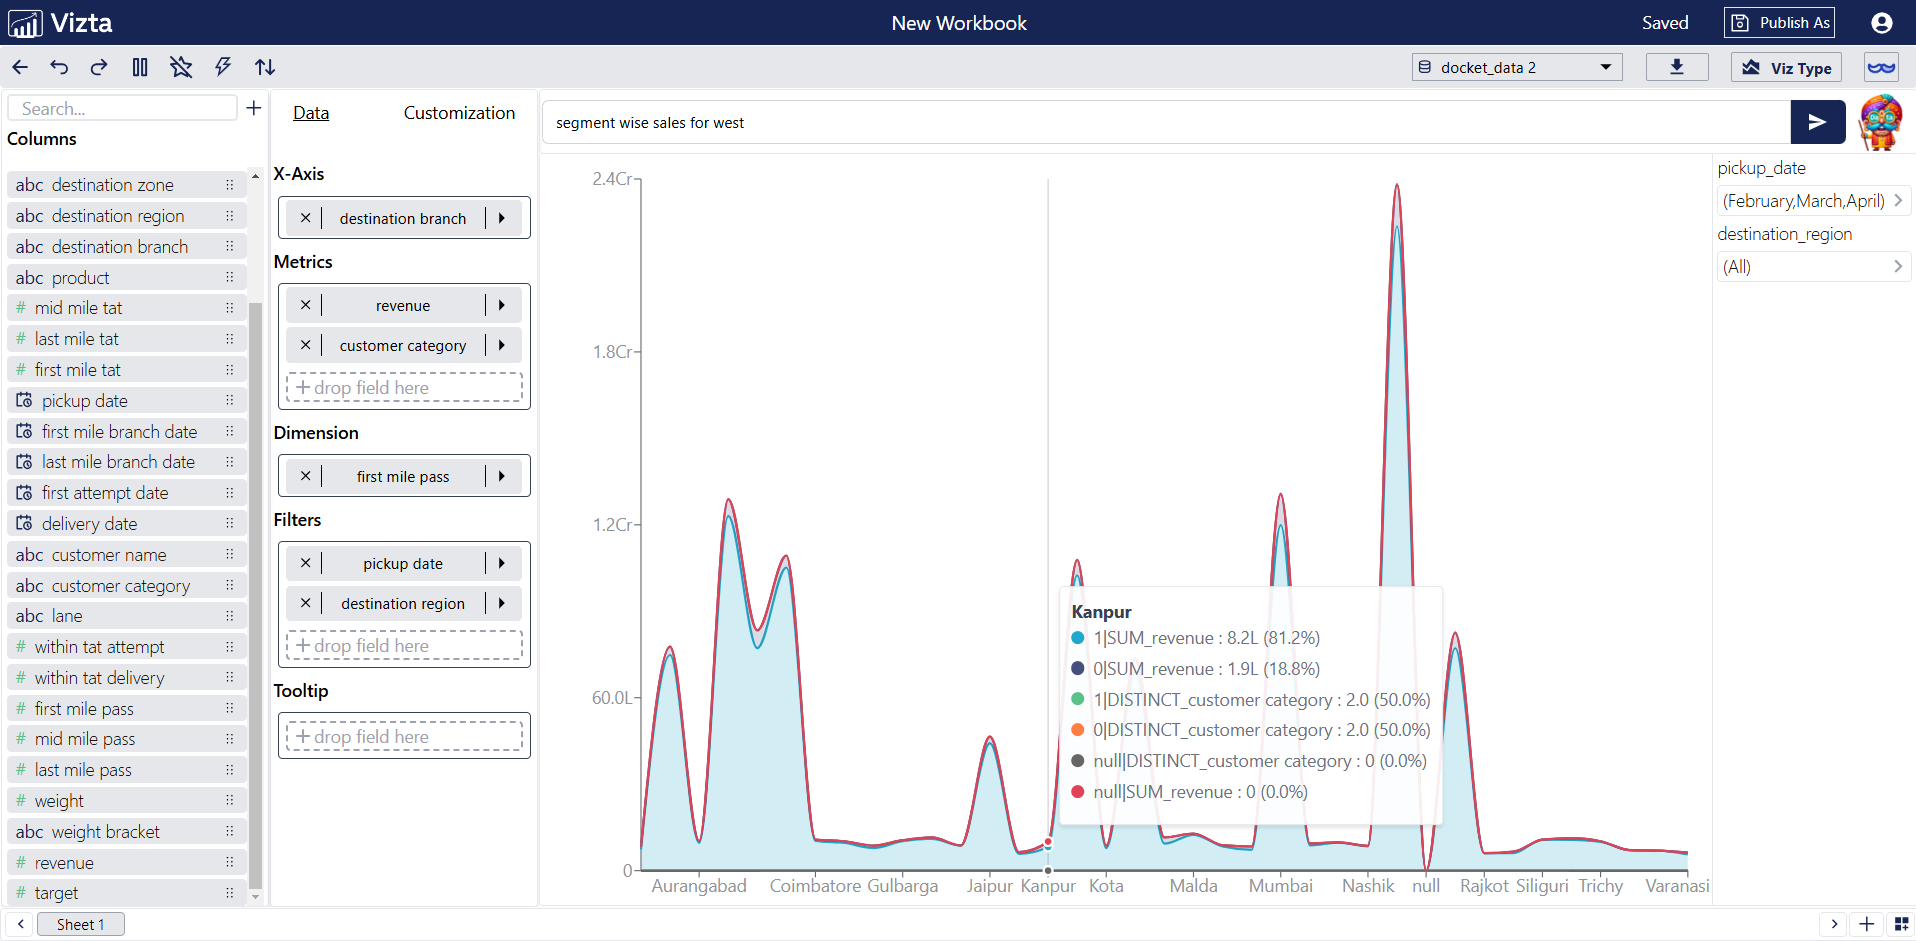
Area charts are a powerful tool for visualizing data trends over time, especially when tracking changes in metrics across different categories or periods. These charts help emphasize the magnitude of changes, making it easier to observe patterns and variations. In Vizta, we use area charts to represent data in a way that highlights the relationship between multiple variables, allowing users to see how one metric evolves in relation to others. Whether you're tracking sales growth, revenue trends, or performance over time, area charts provide a clear visual narrative that makes complex data more digestible. Their stacked design also makes it easy to compare different categories, giving users an intuitive understanding of how each element contributes to the overall trend.
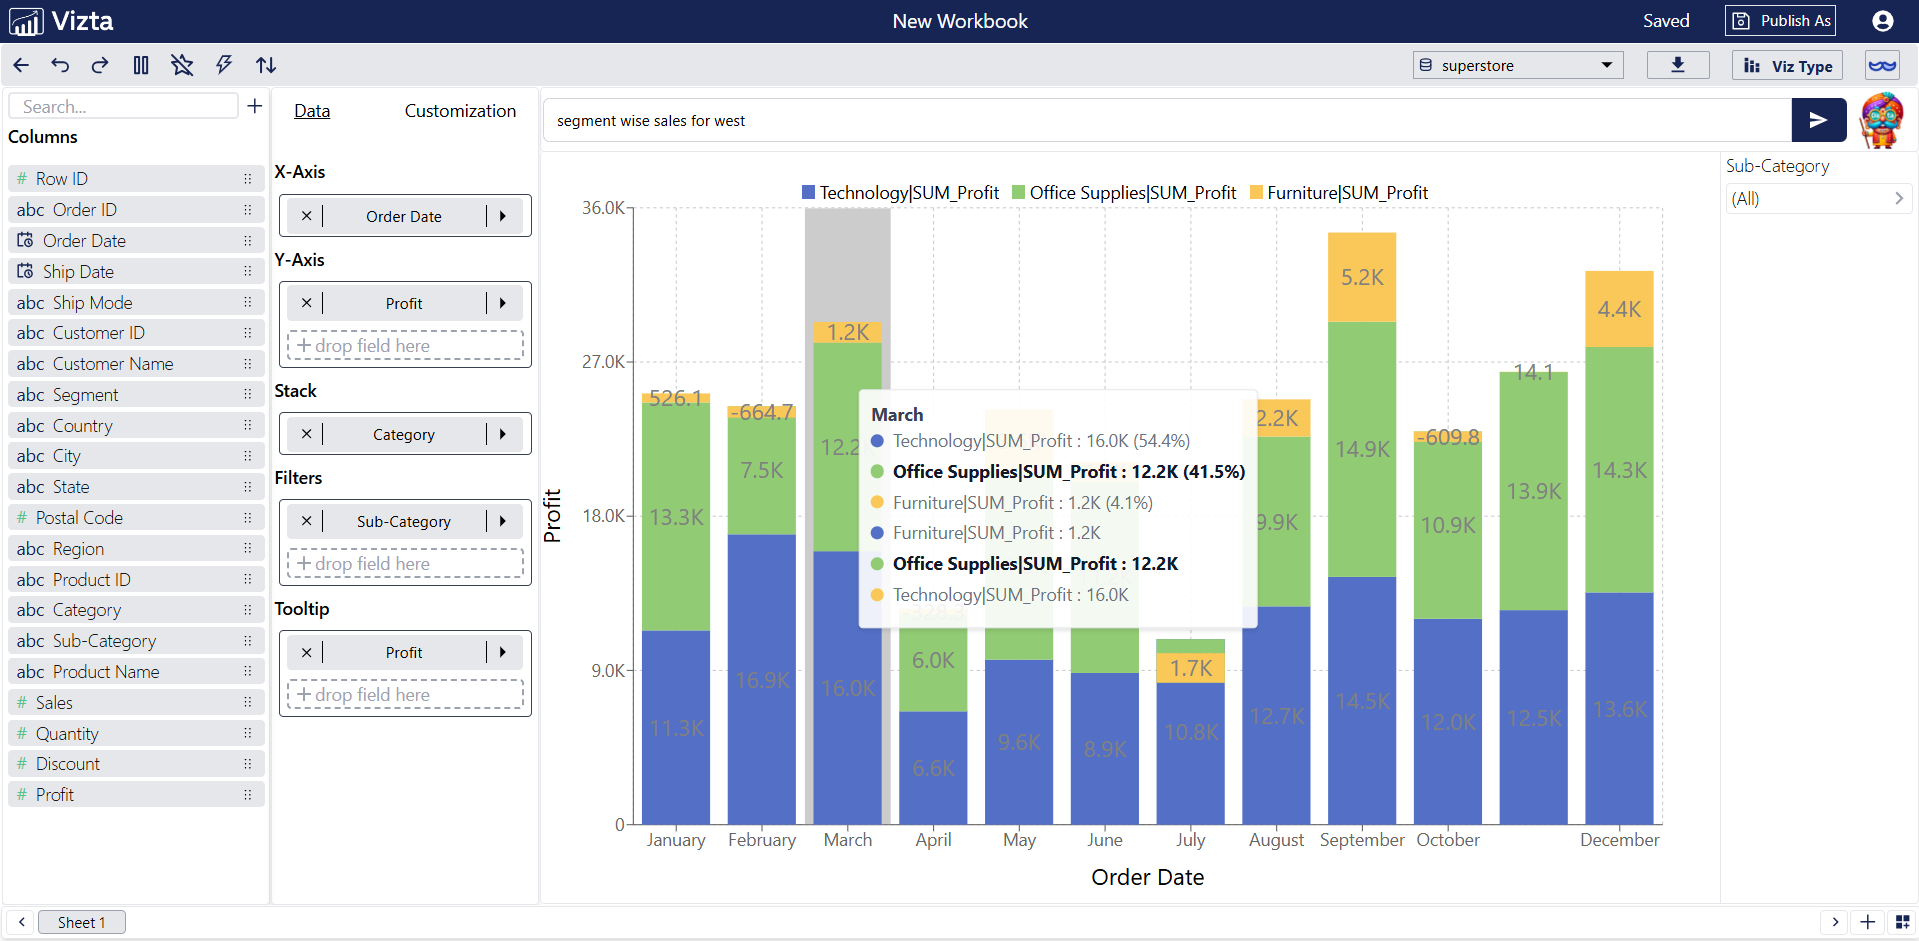
Bar charts are a staple in data visualization. They are especially useful when comparing different categories of data, making it easy to identify trends and outliers. Vizta allows you to create customizable bar charts with interactive elements to further drill down into the data.
In today’s fast-paced, data-driven business world, the right insights at the right time can make all the difference. **Vizta** provides businesses with an intuitive interface and powerful tools to stay ahead, make smarter decisions, and drive success.
As data complexity continues to grow, tools like **Vizta** will play a pivotal role in simplifying the analysis process and empowering businesses to make quicker, more informed decisions. The future of data visualization lies in tools that not only display data but also drive actionable insights through smart, dynamic visualizations.